
The purpose of these notes is to present some facts about the campaign to stop global warming and climate change. The climate has changed in the past, is probably changing now, and will change in the future. The campaign is trying to stop the unstoppable.
The natural factors affecting global temperature are very powerful: terrestrial, solar, galactic, and cosmic. Although the man made contribution to CO2 levels in the atmosphere is claimed to be substantial it is actually very very small and the effect on temperature will be minimal.
1) There are 5 Organisations Which Monitor Global Temperatures:
Terrestrial
GISS Goddard Institute of Space Studies. Part of NASA.;NOAA National Oceanic and Aerospace Administration(USA).;HADCRUT Climatic Research Unit, UK Met Office
Satellite
RSS Remote Sensing Systems.USA.UAH University of Alabama, Huntsville.
They all produce slightly different figures. The terrestrial ones have been "homogenising" the figures i.e. adjusting the recent temperatures upwards and older data downwards for years.I prefer to use the satellite data which is more reliable.
2) Revealing Statements from the IPCC
In 2007 the IPCC Assessment Report 4 contained the following statement in the chapter by Working Group 1 :" The climate system is a coupled non-linear chaotic system and therefore the long term prediction of future climate states is not possible"
And it was further confirmed in 2010 by Ottmar Edenhofer Chairman of the UN – IPCC Working Group 3 who said " One must say clearly that we redistribute de-facto the world's wealth by climate policy..... One has to free oneself from the illusion that international climate policy is environmental policy.This has almost nothing to do with environmental policy any more".(link in http://bit.ly/2QaeDsr). When it became clear during the temperature pause, 1999 onwards, that the forecasts were not supported by the empirical data, Professor Chris Holland of the Hadley Centre for Climate Prediction and Research said: "The data doesn't matter.We are not basing our recommendations on the data.We are basing them on the climate models."Refer to note 15 for model reliability.
Such quotes are never mentioned in the news media.
3) Carbon Dioxide
CO2 in the atmosphere has recently been increasing by about 2 molecules per million molecules (00.0002%) per year and now stands at about 410 molecules per 1,000,000 molecules (00.04%).(ppmv). It forms only a trace in the atmosphere.In 1900 the volume of CO2 in the atmosphere was 3 molecules in 10,000 molecules; in 2016 it was 4 molecules in 10,000; that is an increase of 1 molecule in 10,000 in a period of 116 years and that extra 1 molecule is alleged to have caused the global warming (0.8C). Is the climate of the world so delicately balanced that a change of 1 molecule in 10,000 can cause global warming?CO2 can warm the atmosphere - but not much.These facts are never mentioned in the news media.
4) The Effect of CO2 is Logarithmically Reducing
This means that as more and more gets into the atmosphere the additional CO2 has less and less effect.As we are now at 410 molecules per million any additional CO2 will have only marginal effect.(see paper by Dr. David Archibald available at http://wattsupwiththat.com /2010/03/08/the-logarithmic-effect-of-carbon-dioxide). See the graph on page 2. As to whether the hypothesis that man made CO2 is having any significant effect is correct - well you can see that the answer is probably no. This is never reported in the news media.
The point is that any extra CO2 introduced into the atmosphere now will have no effect on global warming. (Archibald,D, 2007)

5) Measurement of CO2
Since 1958 this has been done by the laboratory at Moana Loa, Hawaii using infrared spectroscopy.Between 1812 and 1961 it was done in various laboratories around the world using the Pettenkofer method. In those 149 years this gave results varying from 270 ppmv (parts per million by volume) to 440ppmv (1 Beck, E. 2007, Energy and Environment 18: p259-282; 2 Plimer, Heaven and Earth p 416). See the graph on page 3. The IPCC have ignored without explanation the thousands of measurements using the Pettenkofer method with the variable results shown on page 3 except to take the lowest figure of 270 ppm as the pre industrial era level which, apparently, is reliable while rejecting the figures of 440 ppmv in 1825 and 1940 as not reliable. Since 1958 the Moana Loa results have shown a consistent rise of about 2 ppmv per year.(See note 6 on page 3) The laboratory is situated near the top of one of the largest volcanoes on earth surrounded by the warm Pacific Ocean.Volcanoes emit large quantities of CO2 and warm seas degas large quantities of CO2 also. Professor Ian Plimer states that over 80% of measurements are dismissed as poor data – i.e. non conforming.

Determination of atmospheric CO2 by the Pettenkofer method (solid line of 5 year averages) between 1812 and 1961, deductions of atmospheric CO2 from Antarctic ice core(gas chromatography) and edited measurements of atmospheric CO2 from Mauna Loa (infra red spectroscopy,1958 and onwards). One method of measurement shows great variability in atmospheric CO2 yet another method does not. The high values of CO2 by the Pettenkofer method have been rejected by the IPCC yet the lowest value is used by the IPCC as the baseline pre-industrial value for atmospheric CO2.Graph derived from Professor Plimer's book "Heaven and Earth" page 420.
6) Growth in CO2 Compared with Global Temperature
It is interesting to note that the increase in CO2 (derived from NOAA via Moana Loa) shows an increase of 2 parts per million per year. Compare this with the graph in point 11, which shows the CO2 emissions increase per year in million metric tonnes.This calculated tremendous growth has had no impact on the annual growth measured by NOAA.

7) The Life of CO2 in the Atmosphere is Short
There are 37 scientific papers which have examined the life of CO2 in the atmosphere. In 35 of them the findings varied between 3 years and 7 years.One of them found 25 years (Suess & Lal 1983). One of them found in excess of 100 years.The Intergovernmental Panel on Climate Change (IPCC) chooses to take 100 years . This is never mentioned in the news media.
8) Methane
Methane is widely claimed to be significant in global warming as it is 20 times more effective than CO2.Its volume in the atmosphere is about 1,800 molecules per billion i.e. less than 2 molecules per million. Yes, like CO2 it can warm the atmosphere but not much.What is more methane quickly and spontaneously oxidises into CO2 and water (Plimer, Heaven and Earth, page 183). This is never reported in the news media.
9) Water Vapour
This is the main warming gas and forms 95% of all the warming gases.It is beyond the control of man. Water vapour has a substantial warming effect. Interestingly water vapour in the form of clouds has both a warming and a cooling effect simultaneously. The net effect is still in dispute. This is never mentioned in the news media.
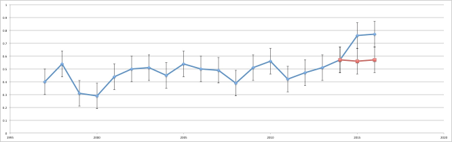
Global temperature anomalies 1998 to 2016 published by GWPF 19th January 2017; derived from Met Office Hadcrut 4 index. Red line is after adjustment for El Nino of 0.2 Degrees C, as calculated by Met Office, anomalies base period average of 1961 to 1990.
According to the laboratory at Moana Loa during most of those 138 years the level of CO2 consistently rose and the hypothesis that CO2 creates dangerous global warming was formulated in the period 1975 to 1998.However, you can see that for 53 of those years the global temperature was rising and for 85 of those years it was falling or steady. Why did the temperature fall when CO2 was rising? These temperature changes can only be seen if measured in tenths of a degree. This is never reported in the news media.
The graph in the following point produced by Anthony Watts shows the changes in global temperature since 1887 converted to a normal wall mounted domestic thermometer.
11) Irregular Global Temperature Rises
It is clear that global temperatures have risen irregularly since the Little Ice Age(at its coldest 1645 to 1715) when rivers in Europe including the Thames were regularly frozen over. The global temperature has risen at a rate of about 0.3C per hundred years since then. The Central England Temperature (CET) from 1659 (see second graph below) shows a rise of approximately 1 degree centigrade. The graph also shows the lack of correlation between CO2 and temperature.Most of that time man produced very little CO2.Natural forces are at work. This is never mentioned by David Attenborough. You can see that warming from 1694 to 1730 was similar to 1988 to 2005. It is interesting to also note that the temperature recorded in 1730 was the same as that recorded in 2008.Until the effect of natural causes of global warming or cooling is established it is impossible to establish the extent of warming caused by manmade CO2 emissions. If any.None of this is ever mentioned in the news media.

Source: Plot of NASA GISS global average surface temperature from 1880 to 2013, with thanks to James Sexton for conversion assistance. Data derived from "Global Land-Ocean Temperature Index in 0.01 degrees Celsius, base period: 1951- 1980", National Aeronautics and Space Administration accessed 10th July 2014 http://data.giss.nasa.gov/gistemp/table.data_v3/GLB.tstdSSTtxt

12) The Reduction in the Number of Weather Stations
The below graph from the National Oceanic and Atmospheric Administration (USA), measuring the amount of weather stations, reveals a reduction of approximately 8000 weather reporting stations mainly in the cooler areas of the globe and it can be clearly seen that the effect on global temperature has been to create a false warming. This is never mentioned in the AR summary reports of the IPCC. Nor is it reported in the news media.

Evolution of land stations and global temperature. Beginning of 1990, thousands of meteo stations located in cooler rural zones (e.g. Siberia, North Canada) stopped recording data (source :ftp://ftp.ncdc.noaa.gov/pub/data:ghcn/v2/v2.temperature.readme).
13) What of the Future?
Many climate scientists believe that the earth is about to enter a 30 year period of cooling based upon the present low number of sunspots. Historic records of sunspots compared with temperature show that periods of low sunspots correlate with periods of low temperature (see graphs below). NOAA have forecast that solar cycle 25 will be the lowest for 200 years, if global temperatures fall to the levels experienced in Solar Cycle 5 during which the Thames froze over at Westminster in 1816 the implication is widespread crop failures. " Professor Henrick Svensmark of the Danish National Space Institute has demonstrated the connection between sunspots and climate identifying that the flow of cosmic rays varies with the number of sunspots. A low number of sunspots allows more cosmic rays to penetrate the earths magnetic field. A high number of spots reduces them. Cosmic rays ultimately develop into nuclei from which raindrops form thus forming clouds. Clouds cool the earth. Thus a low number of sunspots allows more clouds to form leading to periods of colder climate. This process was confirmed by experiments at CERN." No Western government is making preparations for this. This is never reported in the news media.
Daily observations of sunspot numbers from 1st January 1977. Source WDC-SILSO, Royal Observ. Belgium.

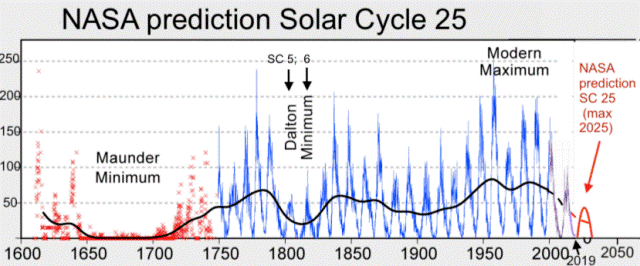
The Maunder Minimum coincided with the Little Ice Age; The Dalton Minimum was another period of intense cold during which the Thames froze over in London in 1816.If the prediction by NASA is correct similarly cold temperatures can be expected. The major effect will be widespread crop failures.
The graph following gives the temperature on the Greenland ice sheet during the last 10,000 years derived from the Greenland Ice Sheet Project 2 (GISP2) ice core.Data source from Joannanova.com.au. The direction of trend is clear.

14) The Forecasts of Catastrophic Anthropogenic Global Warming
IPCC forecasts of increasing CO2 in the atmosphere use computer models which have been severely criticised by sceptical scientists.See the graph below. Until the proportion of CO2 created by natural factors is known the proportion created by man must be unknown. This is never reported in the news media.
15) Computer Model Forecasts
These forecasts indicate an increase in global temperature of between 2C and 6C by the year 2100. The forecasts of 73 models, upon which the IPCC relies for its Assessment Reports, are given below compared with actual observations of global temperatures 1976 to 2012. This is never reported in the news media.

A similar graph can be found at AR5 Technical Summary figure TS-14 with the following discussion in box TS3: However an analysis of the full suite of CMIP5 historical simulations .....reveals that 111 out of 114 realisations show that a GMST trend over 1998 - 2012 is higher than the entire HADCRUT 4 ensemble (box TS3 figure 1a; ensemble mean trend is 0.21C per decade). This difference between simulated and observed trends could be caused by some combination of (a) internal climate variability, (b) missing or incorrect RF, and (c) model response error." GWPF 6.11.19.
16) The Great Barrier Reef, Australia
At a lecture in the House of Lords on 4.11.2019 Dr. Peter Ridd, who has spent 35 years studying the reef, presented the following:Many of the threats to the Great Barrier Reef, such as from sediments and nutrients from agricultural runoff, and from climate change (either natural or manmade), have been greatly exaggerated. Far from being in very poor condition, the GBR is actually one of the most pristine and unspoiled ecosystems on earth. The manifest discrepancy between alarmist claims and observational evidence is due to a systemic failure of Quality Assurance systems used for science and relied upon for public policy decisions. This was not reported in the news media.
17) 2014 the Warmest Year Ever
The terrestrial record (GISS, NOAA, and HADCRUT) give this impression. The graph on page 6 shows that between 1990 and 2000 approximately 8000 weather stations were removed from the record.These were mainly rural stations which experience cooler temperatures than urban stations.If RSS and UAH satellite figures are used (which are far more comprehensive) 2014 turns out to have been cooler than several other years in the last 18. This is compounded with the fact that the terrestrial data records have been altered to raise modern temperatures and reduce historical temperatures (Report by Prof. F.Ewert). This is never reported in the news media.
18) Global Sea Ice
Arctic sea ice and Antarctic sea ice are seasonal. Arctic ice has slowly declined in area for 30 years but at present, September 2018, is 470,000 square miles (1.2 million sq kilometres) more than it was in 2012. This is more than the area of France, Germany, and Italy combined and illustrates the variability of the arctic ice.
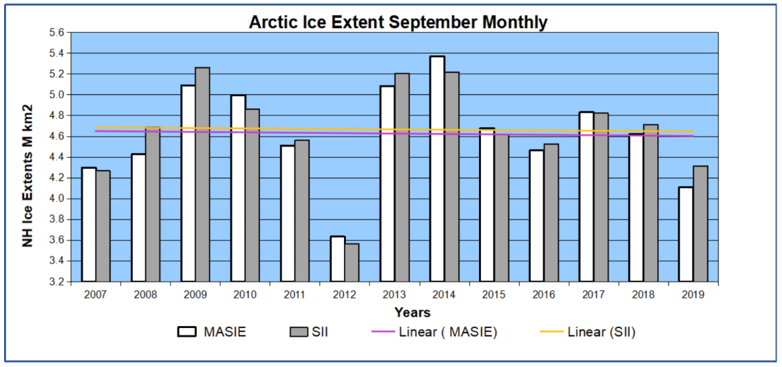
The following graph shows the annual minimum September monthly average sea ice extent in the Northern Hemisphere from 2007 through 2019 according to two different data sets:Sea Ice Index (SII) from NOAA and Multisensor Analyzed Sea Ice Extent (MASIE) from NIC (USA National Ice Centre). The chart begins with 2007 ending a decadal decline and beginning 12 years of fluctuations around a plateau. The linear trend lines are flat for both indices. Antarctic sea ice has consistently increased in last 30 yrs. But has declined slightly in the Weddell Sea in the last 3 years. This is never reported in the news media.
19) Polar Bears
Their population is sparsely spread over the Arctic, the International Union for the Conservation of Nature (IUCN) in 1966 estimated that only 10,000 polar bears remained.In 2006 IUCN estimated that the population had increased to 25,000.In 2017 the number of bears is close to 30,000.Polar bear population does not depend on ice; it depends on the availability of baby seals. This is never reported in the news media.
20) Hurricanes
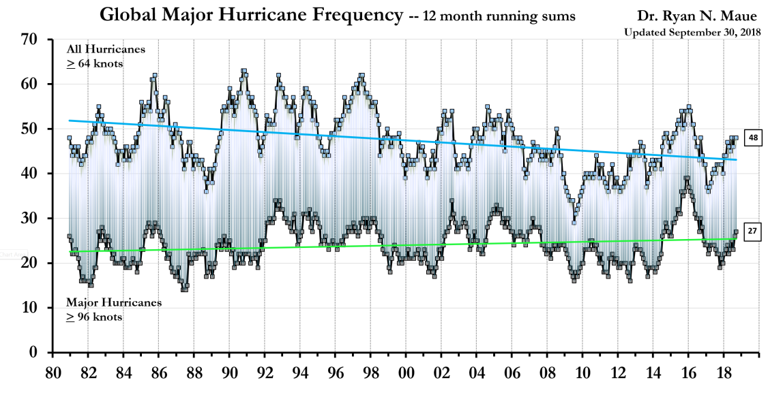
Frequency and intensity is measured using the Accumulated Cyclone Energy Index (ACE).In the last 30 years there has been a steady decline in the number and strength of hurricanes and cyclones. On a scale of 1 - 5 in the last 10 years only 3 of strength 3 or higher have reached land in the USA. See graph below. This is never reported in the news media.
Global hurricane frequency 38 years. Top line is the number of hurricanes exceeding 64 knots – steady decline over 38 years. Bottom line is number exceeding 96 knots – no significant increase.In that period CO2 increased by approx. 76 ppmv. and the temperature anomaly by 0.2 C
21) Tornadoes
These have been declining in frequency in the last 10 years. This is never reported in the news media.
22) Sea Level
The factors affecting sea level are complex:geological, sea temperature causing expansion, and land ice melt.In the last 100 years global sea level has risen by approx. 8 inches. The current rate of increase is about 2 - 3 mm a year and this will cause a rise of about 12 inches by 2100 AD, adaptation is the best approach not the reduction of CO2 in the atmosphere.The graph below shows average sea level at New York 1830 to 2019. This is never reported in the news media.

23) Carbon Dioxide is Plant Food
Plants grow by photosynthesis, using water, sunlight, chlorophyll, and CO2 .CO2 is plant food without which there would be no life on earth – it is one of the basics of the food chain and if it falls below 250 molecules per million, plants will struggle to grow.If it falls below 150 molecules per million the growth is likely to cease.
24) CO2 warming – No Basis in Science
This statement appears in the Energy section of the 2017 UKIP Manifesto. To establish a theory in science it is necessary to follow the Scientific Method. This requires experimental work and the publishing of a paper including all the detailed workings setting out the hypothesis. Other scientists test the hypothesis or compare it with actual observations.If the hypothesis is validated it is accepted as a theory – until someone else disproves it. No laboratory experiment has ever proved that CO2 has the capacity to substantially warm the atmosphere. Professor Peter Ward has offered a prize of $10,000 for the first person to do so.It has never been claimed. This is never reported in the news media.
25) IPCC Motivation
The terms of reference of the Intergovernmental Panel on Climate Change are to examine global warming in the light of Manmade CO2. As a result they do not give consideration to scientific reports which identify different causes or which falsify the reports on which they base their hypothesis. They also, apparently, ignore inconvenient empirical evidence. Their political motivation is to create a system of world government using climate change as a vehicle. This was revealed at the IPCC conference in Copenhagen 2009.A draft treaty (see below) was submitted for approval by the conference which in clause 38 provision was made for a 3 part system of control: Government; Facilitative mechanism; Financial mechanism. The details were very intrusive, effectively controlling national economies to achieve UN objectives.In fact a system of world government run by unelected UN officials. The draft treaty was not approved but the cat was out of the bag. For the avoidance of doubt the draft treaty is provided in point 26 below.
26 Draft Treaty
UN Intergovernmental Panel on Climate Change
Copenhagen 2009 Draft Treaty Clause 38
. 38. The scheme for the new institutional arrangement under the Convention will be based on three basic pillars: government; facilitative mechanism; and financial mechanism, and the basic organization of which will include the following:
(a) The government will be ruled by the Conference of the Parties with the support of a new subsidiary body on adaptation, and of an Executive Board responsible for the management of the new funds and the related facilitative processes and bodies. The current Convention secretariat will operate as such, as appropriate. FCCC/AWGLCA/2009/INF.2 Page 19
(b) The Convention's financial mechanism will include a multilateral climate change fund including five windows:
(a) an Adaptation window,
(b) a Compensation window, to address loss and damage from climate change impacts, including insurance, rehabilitation and compensatory components,
(c) a Technology window;
(d) a Mitigation window; and
(e) a REDD (Reducing Emissions from Deforestation and Degradation) window, to support a multi-phases process for positive forest incentives relating to REDD actions.
(c) The Convention's facilitative mechanism will include:
(a) work programmes for adaptation and mitigation;
(b) a long-term REDD process;
(c) a short-term technology action plan;
(d) an expert group on adaptation established by the subsidiary body on adaptation, and expert groups on mitigation, technologies and on monitoring, reporting and verification; and
(e) an international registry for the monitoring, reporting and verification of compliance of emission reduction commitments, and the transfer of technical and financial resources from developed countries to developing countries.
The secretariat will provide technical and administrative support, including a new centre for information exchange.
Alternative to paragraph 1–38
[The shared vision shall take the form of preambular text that encapsulates both the long-term global goal and pulls together the other elements of the agreed outcome, in the following form:
The Conference of the Parties, seeking to further implement the Convention, in light of evolving science and mindful of evolving economic development and emissions trends, recognizing, in the light of Article 2 (objective) of the Convention, the importance of identifying one or more reference points in the mid-century time frame that can guide the efforts of the Parties and the international community and against which aggregate global efforts can be continually assessed, considering, in that regard, that [ ] is/are desirable global indicator(s), Having a shared vision of [summary that ties together the elements of the agreement].
Conclusions
1) Many peer reviewed papers have been published putting forward causes for warming other than CO2.However, what is needed to stop the madness that has seized governments around the world, and which is causing enormous misallocation of the world's resources, is a rational consideration by experts, from both sides of the argument, of the evidence for warming caused by CO2. This is a widely used technique in industry and commerce known as a Red/Blue assessment to resolve a controversial issue. This must be organised preferably independent of any government agency.
2) Consideration must also be given to the evidence of natural climate change.Until the contribution of natural change to the warming or cooling of the climate is established it is impossible to establish if manmade CO2 has any effect.
3) Recognition of the true purpose of the UN's climate change hypothesis must be publicised.
4)Withdrawal from the targets set by the 2015 Paris Conference and repeal of the Climate Change Act 2008 is now urgent.
Peter Kirby
The views in this opinion article are not necessarily the views of The Bruges Group as a whole